Docker containers are a lightweight, portable, and self-sufficient unit of software that includes everything needed to run an application. Monitoring the resource usage of Docker containers, particularly RAM and CPU, is essential for maintaining performance, identifying bottlenecks, and ensuring that applications run smoothly.
In this tutorial, we will cover various methods to check the RAM and CPU usage of Docker containers. We’ll use both Docker’s built-in tools and external monitoring tools.
Prerequisites
- Docker must be installed and running.
1. Using the docker stats Command
The docker stats command provides a live stream of real-time resource usage statistics for your Docker containers. It helps you monitor the performance and resource consumption of your containers, giving you insights into how much CPU, memory, network, and block I/O each container is using.
docker stats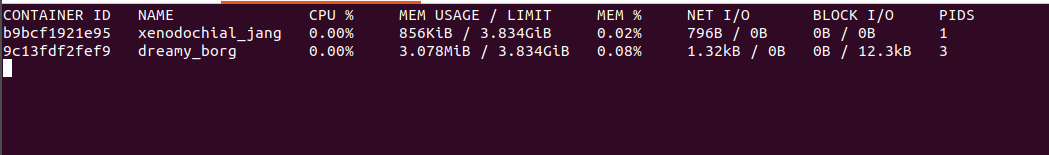
This command outputs a table with the following columns:
- CONTAINER ID: The unique identifier of the container.
- NAME: The name of the container.
- CPU %: The percentage of the host’s CPU the container is using.
- MEM USAGE / LIMIT: The memory usage of the container and the memory limit set for the container.
- MEM %: The percentage of the container’s memory usage relative to its limit.
- NET I/O: The amount of network traffic (in/out).
- BLOCK I/O: The amount of block I/O (read/write).
Additional Options for docker stats
- –all, -a: Show all containers (default shows just running)
- –format: Pretty-print images using a Go template
- –no-stream: Disable streaming stats and only pull the first result
- –no-trunc: Do not truncate output
Example using options:
docker stats --no-stream --format "table {{.Container}}\t{{.Name}}\t{{.CPUPerc}}\t{{.MemUsage}}"This example displays a one-time snapshot of the stats in a table format, showing container ID, name, CPU percentage, and memory usage.
CONTAINER      NAME               CPU %     MEM USAGE / LIMIT
b9bcf1921e95   xenodochial_jang   0.00%     856KiB / 3.834GiB
9c13fdf2fef9   dreamy_borg        0.00%     3.078MiB / 3.834GiB
2. Using the docker inspect Command
The docker inspect command retrieves detailed information about a container. To get the memory and CPU usage, you can inspect a running container and parse the JSON output.
docker inspect You can filter the output using jq or similar tools to get specific information. For example, to get memory usage:
docker inspect --format='{{.State.Pid}}' | xargs -I {} cat /proc/{}/status | grep VmRSSOutput:
VmRSS: 3840 kB3. Using cAdvisor
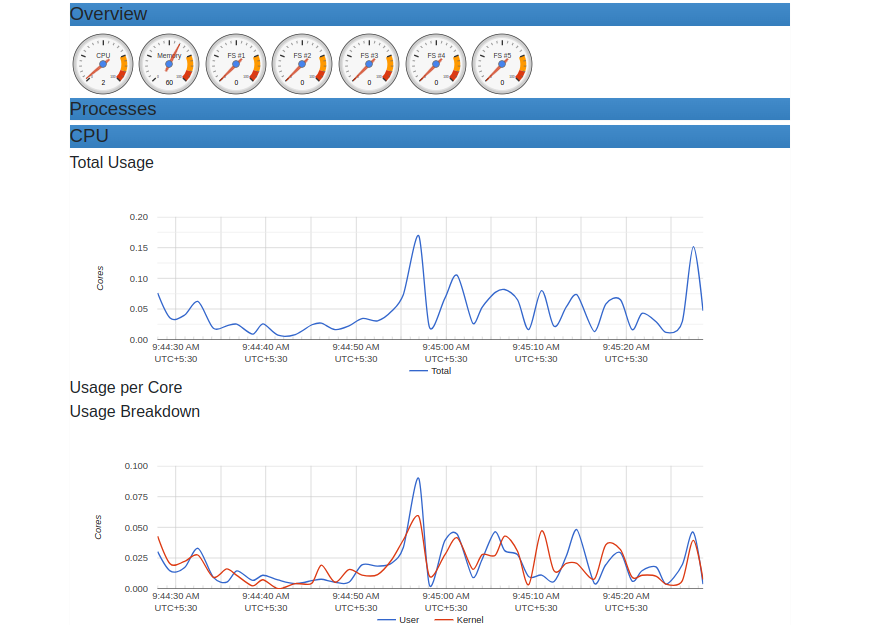
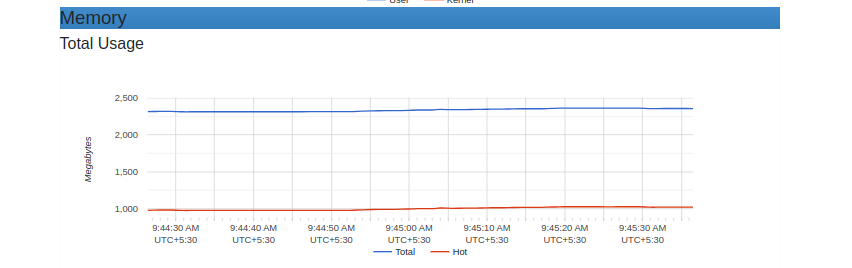
cAdvisor (Container Advisor) is an open-source project from Google that provides container users with an understanding of the resource usage and performance characteristics of their running containers. It collects, aggregates, processes, and exports information about running containers.
Run cAdvisor as a Docker container to start monitoring your other containers.
docker run --volume=/:/rootfs:ro --volume=/var/run:/var/run:ro --volume=/sys:/sys:ro --volume=/var/lib/docker/:/var/lib/docker:ro --publish=8080:8080 --detach=true --name=cadvisor gcr.io/cadvisor/cadvisor:latestNavigate to http://your-server-ip:8080 in your web browser. You will see a dashboard displaying detailed metrics for all running containers, including CPU and memory usage.
4. Using Pseudofiles
Linux provides pseudofiles in the /proc and /sys/fs/cgroup directories, which contain information about system and process metrics. These can be used to monitor Docker container resource usage.
To check memory usage, you can use the cgroup pseudofiles. First, find the container’s cgroup path:
docker inspect --format '{{.Id}}' Output:
cadvisor	54310651ae8a769a782fea91c322c47a5dea14df6f359d6aa8f5a161121e0915
xenodochial_jang	b9bcf1921e958824d15e686ab400d0d0834b6d0c321fcb75c897f2329616eb7a
dreamy_borg	9c13fdf2fef92a9fba52cb09a3fa5f313ebaa566692f8de702497aaf456b70e0
Use the container ID to navigate to its memory usage file:
cat /sys/fs/cgroup/system.slice/docker-9c13fdf2fef92a9fba52cb09a3fa5f313ebaa566692f8de702497aaf456b70e0.scope/memory.stat Output:
anon 2506752
file 73728
kernel_stack 49152
pagetables 139264
percpu 72
sock 0
shmem 4096
file_mapped 4096
file_dirty 0
file_writeback 0
swapcached 0
anon_thp 0
file_thp 0
shmem_thp 0
inactive_anon 2498560
active_anon 12288
inactive_file 16384
active_file 53248
unevictable 0
slab_reclaimable 237840
slab_unreclaimable 157672
slab 395512
workingset_refault_anon 0
workingset_refault_file 0
workingset_activate_anon 0
workingset_activate_file 0
workingset_restore_anon 0
workingset_restore_file 0
workingset_nodereclaim 0
pgfault 4042
pgmajfault 0
pgrefill 0
pgscan 0
pgsteal 0
pgactivate 4
pgdeactivate 0
pglazyfree 0
pglazyfreed 0
thp_fault_alloc 0
thp_collapse_alloc 0
CPU usage can be monitored similarly:
cat /sys/fs/cgroup/system.slice/docker-9c13fdf2fef92a9fba52cb09a3fa5f313ebaa566692f8de702497aaf456b70e0.scope/cpu.statThis file displays the total CPU time (in nanoseconds) consumed by the container.
usage_usec 120676
user_usec 52454
system_usec 68221
nr_periods 0
nr_throttled 0
throttled_usec 0
Conclusion
Monitoring Docker container resource usage is essential for maintaining application performance and stability. The methods covered in this tutorial offer different levels of detail and flexibility. Use Docker stats and inspect for quick checks, cAdvisor for comprehensive overviews, and pseudofiles for low-level metrics. You can now easily check CPU and Memory usage on dedicated server hosting from Atlantic.Net!
* This post is for informational purposes only and does not constitute professional, legal, financial, or technical advice. Each situation is unique and may require guidance from a qualified professional.
Readers should conduct their own due diligence before making any decisions.