Nagios is a free and open-source monitoring solution that helps system administrators keep an eye on network infrastructure. It allows you to add and monitor remote servers, switches, and routers from a single place. Nagios offers a lot of plugins that help you to add additional functionality to your server. Nagios makes it easier to quickly detect any issues on servers and send alerts to minimize application downtime for users.
In this tutorial, we will show you how to install the Nagios monitoring server on Fedora.
Step 1 – Install Required Dependencies
Before starting, you will need to install Apache, PHP, and additional required dependencies on your server. You can install all of them using the following command.
dnf install httpd httpd-tools php gcc glibc glibc-common gd gd-devel make net-snmp openssl-devel -y
Once all the packages are installed, you can proceed to the next step.
Step 2 – Install Nagios
By default, the Nagios package is not available in the Fedora default repo, so you will need to compile it from the source.
First, add a Nagios user and add it to the Nagios group.
useradd nagios
usermod -G nagios nagios
Also, add the Apache user to the Nagios group.
usermod -G nagios apache
Next, create a directory for Nagios.
mkdir /root/nagios
Then, navigate inside the Nagios directory and download the latest version of Nagios and Nagios plugins.
cd /root/nagios
wget https://assets.nagios.com/downloads/nagioscore/releases/nagios-4.4.9.tar.gz
wget https://nagios-plugins.org/download/nagios-plugins-2.3.3.tar.gz
Next, extract both downloaded files.
tar -xf nagios-4.4.9.tar.gz
tar -xf nagios-plugins-2.3.3.tar.gz
Next, change the directory to the extracted directory and configure it with the following command.
cd nagios-4.4.9/
./configure --with-command-group=nagios
Output:
 General Options:
 -------------------------
        Nagios executable:  nagios
        Nagios user/group:  nagios,nagios
       Command user/group:  nagios,nagios
             Event Broker:  yes
        Install ${prefix}:  /usr/local/nagios
    Install ${includedir}:  /usr/local/nagios/include/nagios
                Lock file:  /run/nagios.lock
   Check result directory:  /usr/local/nagios/var/spool/checkresults
           Init directory:  /lib/systemd/system
  Apache conf.d directory:  /etc/httpd/conf.d
             Mail program:  /bin/mail
                  Host OS:  linux-gnu
          IOBroker Method:  epoll

 Web Interface Options:
 ------------------------
                 HTML URL:  http://localhost/nagios/
                  CGI URL:  http://localhost/nagios/cgi-bin/
 Traceroute (used by WAP):  /usr/bin/traceroute
Next, install the Nagios using the following command.
make all
make install
Next, install the Init script, command mode, and sample configuration files using the following command.
make install-init
make install-commandmode
make install-config
Next, install the Nagios web interface using the following command.
make install-webconf
Next, create a user and password for Nagios.
htpasswd -s -c /usr/local/nagios/etc/htpasswd.users nagiosadmin
Set your password as shown below.
New password:
Re-type new password:
Adding password for user nagiosadmin
Next, restart the Apache service to apply the changes.
systemctl restart httpd
Step 3 – Install Nagios Plugins
First, change the directory to the Nagios plugins and configure it with the following command.
cd /root/nagios/nagios-plugins-2.3.3
./configure --with-nagios-user=nagios --with-nagios-group=nagios
Now, install it with the following command.
make
make install
Now, verify the Nagios configuration using the following command.
/usr/local/nagios/bin/nagios -v /usr/local/nagios/etc/nagios.cfg
If everything is fine, you will see the following output.
Checking objects...
	Checked 8 services.
	Checked 1 hosts.
	Checked 1 host groups.
	Checked 0 service groups.
	Checked 1 contacts.
	Checked 1 contact groups.
	Checked 24 commands.
	Checked 5 time periods.
	Checked 0 host escalations.
	Checked 0 service escalations.
Checking for circular paths...
	Checked 1 hosts
	Checked 0 service dependencies
	Checked 0 host dependencies
	Checked 5 timeperiods
Checking global event handlers...
Checking obsessive compulsive processor commands...
Checking misc settings...

Total Warnings: 0
Total Errors:   0

Things look okay - No serious problems were detected during the pre-flight check
Step 4 – Start Nagios Service
At this point, Nagios is installed on your server. Now, enable the Apache and Nagios service using the following command.
systemctl enable nagios
systemctl enable httpd
Then, restart the Nagios service to apply the changes.
systemctl restart nagios
You can verify the status of Nagios using the following command.
systemctl status nagios
You will see the following output.
● nagios.service - Nagios Core 4.4.9
     Loaded: loaded (/usr/lib/systemd/system/nagios.service; disabled; vendor preset: disabled)
     Active: active (running) since Sat 2023-06-24 06:46:41 EDT; 8s ago
       Docs: https://www.nagios.org/documentation
    Process: 47713 ExecStartPre=/usr/local/nagios/bin/nagios -v /usr/local/nagios/etc/nagios.cfg (code=exited, status=0/SUCCESS)
    Process: 47714 ExecStart=/usr/local/nagios/bin/nagios -d /usr/local/nagios/etc/nagios.cfg (code=exited, status=0/SUCCESS)
   Main PID: 47715 (nagios)
      Tasks: 6 (limit: 4666)
     Memory: 5.0M
        CPU: 81ms
     CGroup: /system.slice/nagios.service
             ├─47715 /usr/local/nagios/bin/nagios -d /usr/local/nagios/etc/nagios.cfg
             ├─47717 /usr/local/nagios/bin/nagios --worker /usr/local/nagios/var/rw/nagios.qh
             ├─47718 /usr/local/nagios/bin/nagios --worker /usr/local/nagios/var/rw/nagios.qh
             ├─47719 /usr/local/nagios/bin/nagios --worker /usr/local/nagios/var/rw/nagios.qh
             ├─47720 /usr/local/nagios/bin/nagios --worker /usr/local/nagios/var/rw/nagios.qh
             └─47721 /usr/local/nagios/bin/nagios -d /usr/local/nagios/etc/nagios.cfg
Step 5 – Access Nagios Web Interface
At this point, Nagios is installed and running on your server. Now, open your web browser and access the Nagios web UI using the URL http://your-server-ip/nagios. You will see the Nagios login screen.
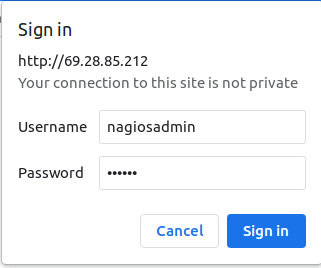
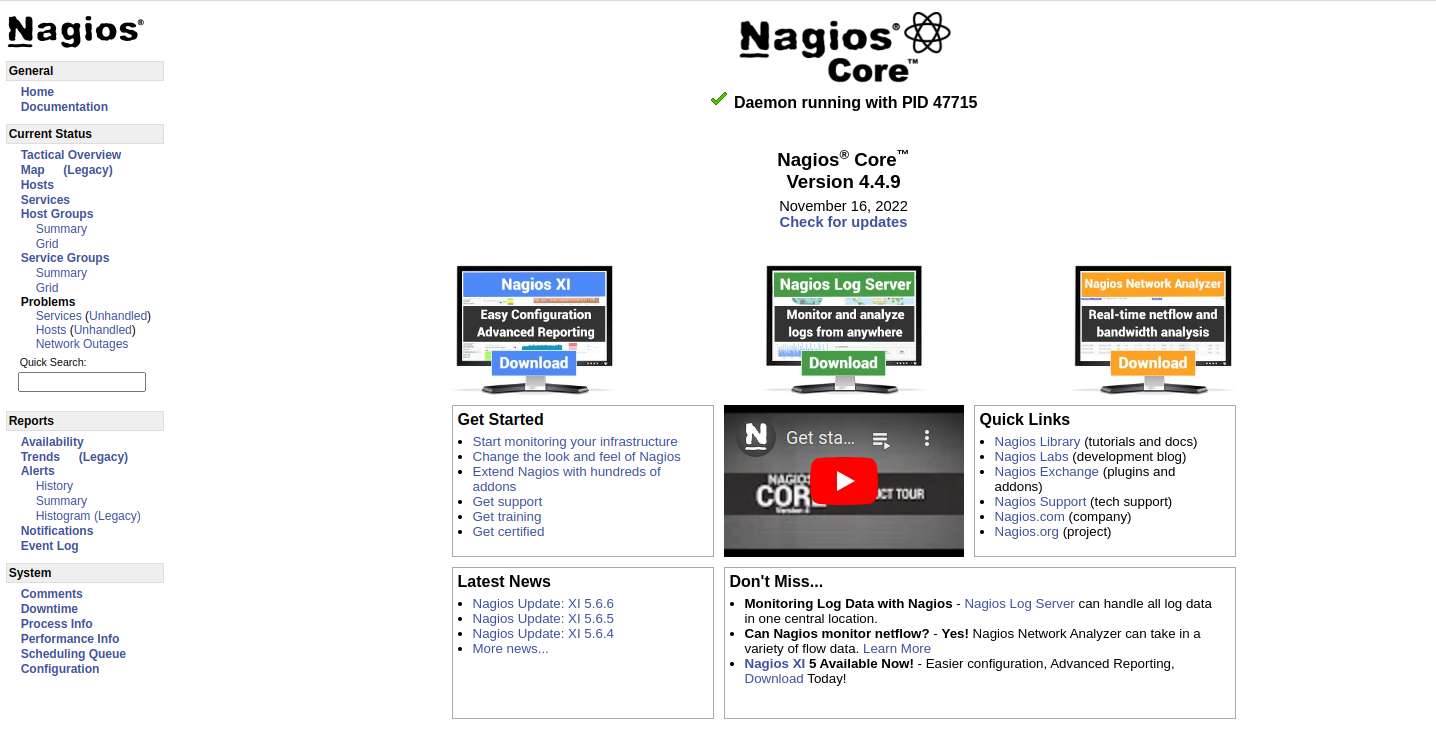
Provide your username, password and click on the Sign in button. After the successful authentication, you should see the Nagios dashboard.
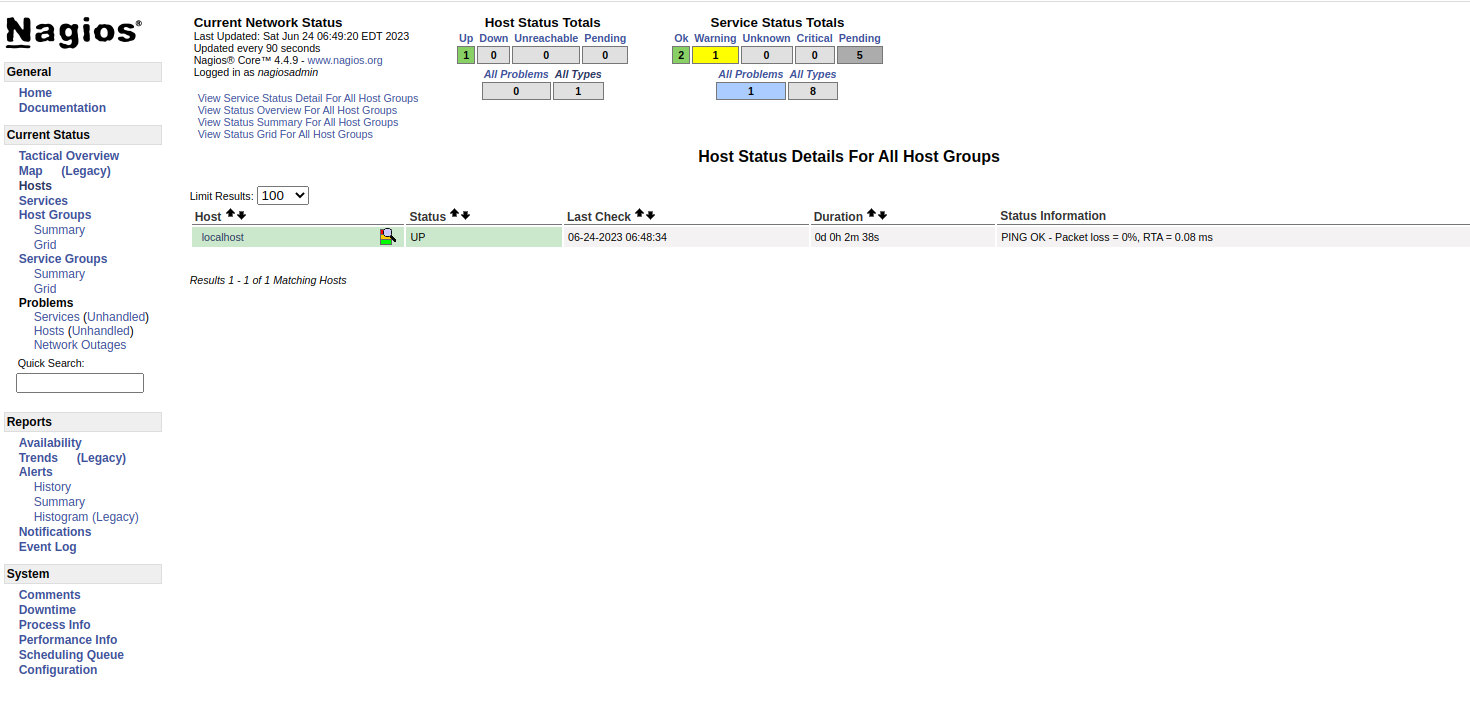
Click on the Hosts in the left pane, you will see your host information on the following screen.
Conclusion
In this post, we showed you how to install Nagios from the source on Fedora. You can now add remote servers to your Nagios server and start monitoring them from the Nagios UI. Try to implement the Nagios monitoring server on dedicated server hosting from Atlantic.Net!
* This post is for informational purposes only and does not constitute professional, legal, financial, or technical advice. Each situation is unique and may require guidance from a qualified professional.
Readers should conduct their own due diligence before making any decisions.