Monitoring network bandwidth is crucial for maintaining a well-functioning and efficient system. Whether you’re a system administrator overseeing multiple servers or an individual managing your home network, understanding the network usage can help you identify bottlenecks, optimize performance, and detect potential issues early.
bmon (Bandwidth Monitor) is a powerful, real-time bandwidth monitoring tool designed for Unix-like operating systems, including Ubuntu. It provides detailed information about your network bandwidth usage, presenting data in a user-friendly, graphical interface.
This tutorial will guide you through the installation and usage of bmon on Ubuntu 22.04.
Step 1 – Installing bmon
First, you need to install bmon. It is available in the default Ubuntu repositories, so you can install it using the apt package manager.
Update the package list:
apt update -yAfter updating the apt cache, install bmon using the following command:
apt install bmon -yStep 2 – How to Use bmon
Once installed, you can start using bmon to monitor your network bandwidth in real time.
bmonBy default, bmon will start displaying the bandwidth usage of all available network interfaces.
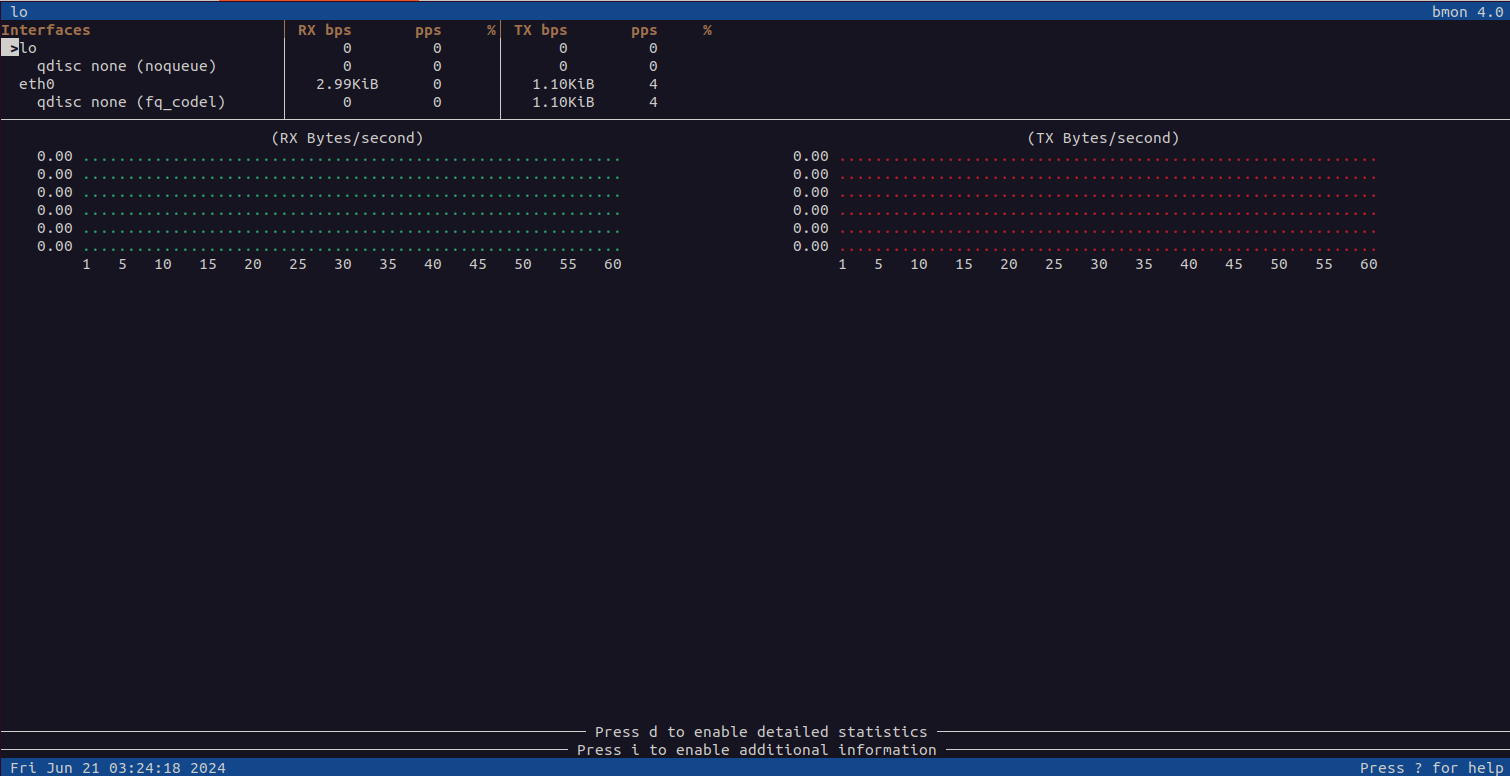
When you run bmon, you will see several sections and columns on the screen. Here’s a breakdown of what each part represents:
- Interfaces Section: This section lists all detected network interfaces along with their current bandwidth usage statistics.
- Statistics Section: Displays detailed statistics for the selected interface, such as:
- RX: Received bytes/packets.
- TX: Transmitted bytes/packets.
- Errors: Number of errors.
- Dropped: Number of dropped packets.
- Overruns: Number of overruns.
- Frame: Frame errors.
- Rate Graph: A graphical representation of the bandwidth usage over time for the selected interface.
Step 3 – Command-Line Options and Key Bindings
bmon supports several command-line options to customize its behavior. Some of the most useful options include:
Use the -p flag to specify which network interfaces to monitor. For example:
bmon -p eth0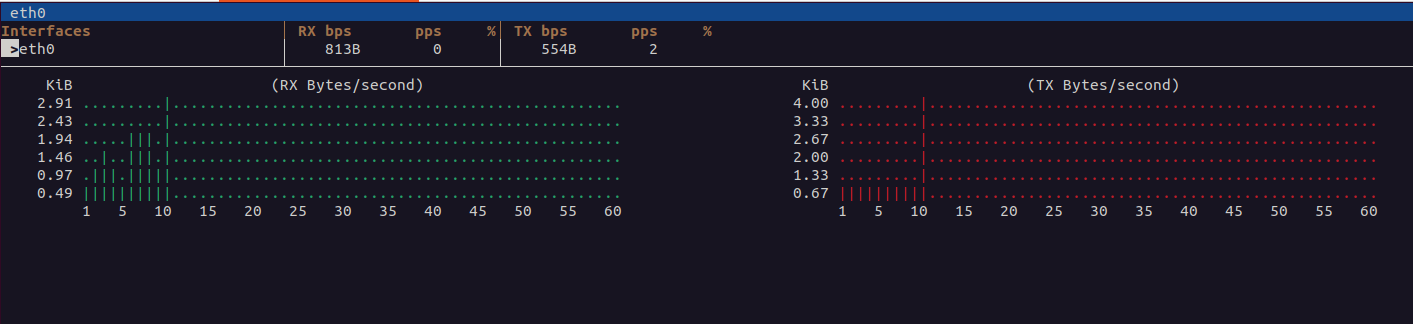
Use the -o flag to set the output module. bmon supports several output modules, such as ASCII and curses. By default, curses is used. For example:
bmon -p eth0 -o asciiOutput:
Interfaces                               RX bps         pps      %    TX bps         pps      %
  eth0                                        0           0                0           0
Interfaces                               RX bps         pps      %    TX bps         pps      %
  eth0                                      885B          0              293B          0
Interfaces                               RX bps         pps      %    TX bps         pps      %
  eth0                                     2.15KiB        0              293B          0
Interfaces                               RX bps         pps      %    TX bps         pps      %
  eth0                                     2.77KiB        0              334B          1
Interfaces                               RX bps         pps      %    TX bps         pps      %
  eth0                                     2.82KiB        0              303B          1
Use the -r option to set the read interval in seconds. This determines how frequently bmon will update the statistics. For example, to update every 2 seconds:
bmon -p eth0 -r 2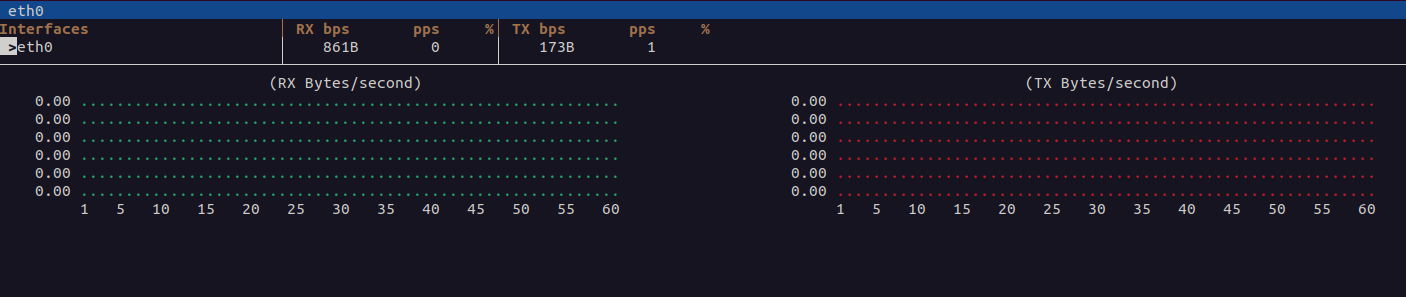
You can use the -s option to set the storage module, which determines where the data is read from. For example:
bmon -p eth0 -s netlink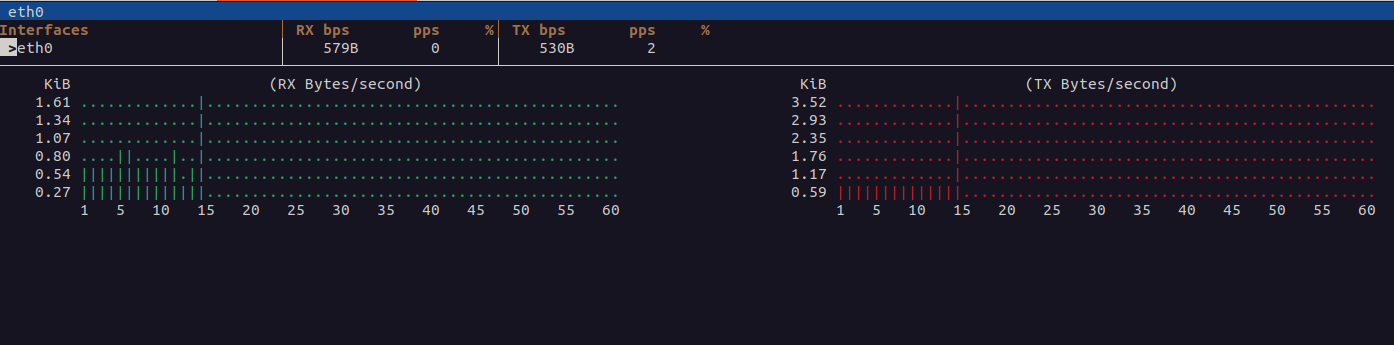
Key Bindings
While running bmon, you can use the following keys to navigate and customize the display:
- Left/Right Arrow Keys: Switch between different network interfaces.
- Up/Down Arrow Keys: Scroll through the statistics of the selected interface.
- Tab: Switch between different sections (interfaces, statistics, graph).
- g: Toggle the graph display.
- d: Toggle detailed interface statistics.
- q: Quit bmon.
Conclusion
bmon is a powerful tool for monitoring network bandwidth usage in real time on Ubuntu 22.04. By understanding its command-line options and interface, you can effectively track and debug network performance issues. Try to install bmon on dedicated server hosting from Atlantic.Net!
* This post is for informational purposes only and does not constitute professional, legal, financial, or technical advice. Each situation is unique and may require guidance from a qualified professional.
Readers should conduct their own due diligence before making any decisions.