Clustering is a fundamental unsupervised machine learning technique for grouping similar data points together. K-means clustering is one of the most popular clustering algorithms due to its simplicity and efficiency. However, with large datasets, the computational cost can be high. Leveraging GPU acceleration can greatly reduce the time taken for clustering and make it possible to work with large data.
In this article, we will review how to do K-means clustering on an Ubuntu GPU server.
Prerequisites
Before starting, ensure you have the following:
- An Ubuntu 24.04 Cloud GPU Server.
- CUDA Toolkit and cuDNN Installed.
- A root or sudo privileges.
Step 1: Setting Up the Python Environment
First, you will need to set up the environment for Python.
1. Add the Python 3.10 repository.
add-apt-repository ppa:deadsnakes/ppa2. Install Python3.10 and pip.
apt install python3 python3-venv python3-dev3. Create a Python virtual environment.
python3.10 -m venv venv-kmeans
source venv-kmeans/bin/activate
4. Upgrade pip to the latest version.
pip install --upgrade pip5. Install the necessary libraries.
pip install cuml-cu12 --extra-index-url=https://pypi.nvidia.com
pip3 install matplotlib numpy
The cuml-cu12 package is a GPU-accelerated machine learning library from NVIDIA, and matplotlib is used for data visualization.
6. Install Nvidia CUDA
apt install nvidia-cuda-toolkit -y
7. Instal cuDNN Drivers.
wget https://developer.download.nvidia.com/compute/cuda/repos/ubuntu2204/x86_64/cuda-keyring_1.1-1_all.debsudo dpkg -i cuda-keyring_1.1-1_all.debsudo apt-get updatesudo apt-get -y install cudnnStep 2: Generating Synthetic Data
Synthetic data is often used to test and prototype machine learning algorithms. It allows you to control the data distribution and size, making it easier to validate the clustering algorithm.
1. Create a file named generate_data.py.
nano generate_data.pyAdd the following code:
# generate_data.py
import numpy as np

# Generate synthetic data
np.random.seed(42)
data = np.random.rand(1000, 2)  # 1000 points in 2D space

# Save the data to a file
np.save('data.npy', data)
print("Data generated and saved to 'data.npy'.")
2. Run the script to generate and save the data:
python3 generate_data.pyThis script generates 1000 random points in 2D space and saves them to a file named data.npy.
Data generated and saved to 'data.npy'.Step 3: Performing K-means Clustering
K-means clustering is used to partition the data into a predefined number of clusters. Using GPU acceleration significantly speeds up the computation, especially for large datasets.
1. Create a file named kmeans_clustering.py.
nano kmeans_clustering.pyAdd the following code:
# kmeans_clustering.py
import numpy as np
from cuml import KMeans
import matplotlib.pyplot as plt

# Load the generated data
data = np.load('data.npy')

# Perform K-means clustering
kmeans = KMeans(n_clusters=3, random_state=42)
kmeans.fit(data)

# Get the cluster labels and centroids
labels = kmeans.labels_
centroids = kmeans.cluster_centers_

# Save the results
np.save('labels.npy', labels)
np.save('centroids.npy', centroids)

# Visualize the clusters
plt.scatter(data[:, 0], data[:, 1], c=labels, cmap='viridis', s=50)
plt.scatter(centroids[:, 0], centroids[:, 1], c='red', marker='X', s=200, alpha=0.75)
plt.title('K-means Clustering')
plt.savefig('clusters.png')
plt.show()

print("Clustering completed. Results saved to 'labels.npy', 'centroids.npy', and 'clusters.png'")
2. Run the script to perform clustering and visualize the results:
python3 kmeans_clustering.py This script performs K-means clustering on the data, saves the cluster labels and centroids to files, and visualizes the clusters using matplotlib. The resulting plot is saved as clusters.png.
Clustering completed. Results saved to 'labels.npy', 'centroids.npy', and 'clusters.png'Explanation of each file:
labels.npy: Contains the cluster assignment for each data point (0, 1, or 2).
centroids.npy: Contains the coordinates of the 3 cluster centers.
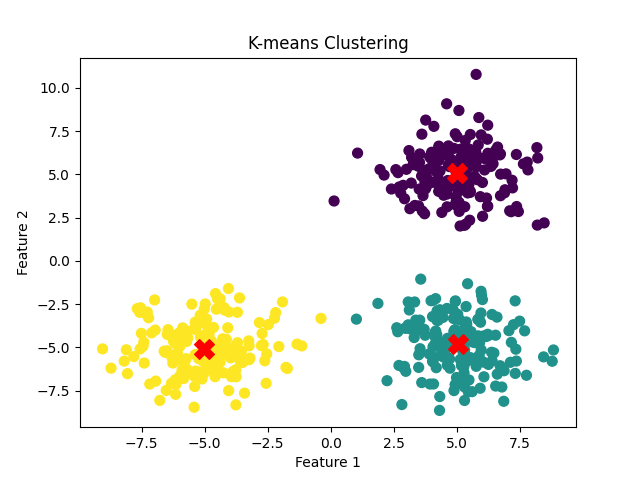
clusters.png: A scatter plot showing the data points colored by their cluster assignments and the centroids marked with red “X” symbols.
Here is clusters.png
Step 4: Checking GPU Utilization
Monitoring GPU utilization ensures that the GPU is being used effectively for computation. This is crucial for optimizing performance and diagnosing potential issues.
You can check the GPU status using the nvidia-smi command:
nvidia-smiThis command provides information about the GPU, including its utilization, memory usage, and running processes.
Sun Feb 23 05:07:52 2025
+-----------------------------------------------------------------------------------------+
| NVIDIA-SMI 550.90.07              Driver Version: 550.90.07      CUDA Version: 12.4     |
|-----------------------------------------+------------------------+----------------------+
| GPU  Name                 Persistence-M | Bus-Id          Disp.A | Volatile Uncorr. ECC |
| Fan  Temp   Perf          Pwr:Usage/Cap |           Memory-Usage | GPU-Util  Compute M. |
|                                         |                        |               MIG M. |
|=========================================+========================+======================|
|   0  NVIDIA A40-8Q                  On  |   00000000:06:00.0 Off |                    0 |
| N/A   N/A    P8             N/A /  N/A  |       1MiB /   8192MiB |      0%      Default |
|                                         |                        |                  N/A |
+-----------------------------------------+------------------------+----------------------+

+-----------------------------------------------------------------------------------------+
| Processes:                                                                              |
|  GPU   GI   CI        PID   Type   Process name                              GPU Memory |
|        ID   ID                                                               Usage      |
|=========================================================================================|
|  No running processes found                                                             |
+-----------------------------------------------------------------------------------------+
Conclusion
In this article, we walked through the process of setting up a Python environment on an Ubuntu GPU server, generating synthetic data, performing K-means clustering using GPU-accelerated libraries, and visualizing the results. If you follow these steps, you can use GPU acceleration for clustering.
* This post is for informational purposes only and does not constitute professional, legal, financial, or technical advice. Each situation is unique and may require guidance from a qualified professional.
Readers should conduct their own due diligence before making any decisions.