An ELK stack is a group of three popular open-source components: Elasticsearch, Logstash, and Kibana. An ELK stack helps you to capture logs of all your systems and applications and analyze and create a visual dashboard for application monitoring. Elasticsearch is a search engine, Logstash is a server‑side data processing pipeline and Kibana lets users visualize data with charts and graphs in Elasticsearch.
In this post, we will show you how to install the ELK stack on Fedora
Step 1 – Install Java JDK
ELK stack is based on Java, so Java JDK must be installed on your server. If not installed, you can install it with the following command.
dnf update -y
dnf install java-openjdk-devel java-openjdk
Once Java JDK is installed, you can verify it with the following command.
java -version
You will get the Java version in the following output.
openjdk version "11.0.10" 2021-01-19
OpenJDK Runtime Environment 18.9 (build 11.0.10+9)
OpenJDK 64-Bit Server VM 18.9 (build 11.0.10+9, mixed mode, sharing)
Step 2 – Install Elasticsearch
By default, the Elasticsearch package is not included in the Fedora default repo, so you will need to create an Elasticsearch repo on your server. You can create it with the following command.
nano /etc/yum.repos.d/elasticsearch.repo
Add the following configuration.
[elasticsearch-8.x]
name=Elasticsearch repository for 8.x packages
baseurl=https://artifacts.elastic.co/packages/8.x/yum
gpgcheck=1
gpgkey=https://artifacts.elastic.co/GPG-KEY-elasticsearch
enabled=1
autorefresh=1
type=rpm-md
Save and close the file, then import the Elasticsearch key using the following command.
rpm --import https://artifacts.elastic.co/GPG-KEY-elasticsearch
Next, clean all package caches with the following command.
yum clean all
yum makecache
Finally, install the Elasticsearch package with the following command.
dnf install elasticsearch
Next, start the enable the Elasticsearch service with the following command.
systemctl enable --now elasticsearch.service
You can verify the status of Elasticsearch with the following command.
systemctl status elasticsearch
Output.
● elasticsearch.service - Elasticsearch
     Loaded: loaded (/usr/lib/systemd/system/elasticsearch.service; enabled; vendor preset: disabled)
     Active: active (running) since Mon 2023-06-05 12:11:26 EDT; 13s ago
       Docs: https://www.elastic.co
   Main PID: 132617 (java)
      Tasks: 75 (limit: 4666)
     Memory: 2.3G
        CPU: 1min 2.533s
     CGroup: /system.slice/elasticsearch.service
             ├─132617 /usr/share/elasticsearch/jdk/bin/java -Xms4m -Xmx64m -XX:+UseSerialGC -Dcli.name=server -Dcli.script=/usr/share/elasticsearch/bin/elasticsearch ->
             ├─132673 /usr/share/elasticsearch/jdk/bin/java -Des.networkaddress.cache.ttl=60 -Des.networkaddress.cache.negative.ttl=10 -Djava.security.manager=allow -X>
             └─132706 /usr/share/elasticsearch/modules/x-pack-ml/platform/linux-x86_64/bin/controller

Jun 05 12:10:55 freepbx systemd[1]: Starting Elasticsearch...
Jun 05 12:11:26 freepbx systemd[1]: Started Elasticsearch.
Next, you will need to set the Elasticsearch password. You can set it with the following command.
/usr/share/elasticsearch/bin/elasticsearch-reset-password -u elastic -i
Set your password as shown below.
This tool will reset the password of the [elastic] user.
You will be prompted to enter the password.
Please confirm that you would like to continue [y/N]y
Enter password for [elastic]:
Re-enter password for [elastic]:
Password for the [elastic] user successfully reset.
Next, verify Elasticsearch using the following command.
curl --cacert /etc/elasticsearch/certs/http_ca.crt -u elastic https://localhost:9200
You will be asked to provide your password to perform the query. After the successful authentication, you will get the following output.
Enter host password for user 'elastic':
{
  "name" : "freepbx",
  "cluster_name" : "elasticsearch",
  "cluster_uuid" : "g13oMGscTzqXwHqacXMYwg",
  "version" : {
    "number" : "8.8.0",
    "build_flavor" : "default",
    "build_type" : "rpm",
    "build_hash" : "c01029875a091076ed42cdb3a41c10b1a9a5a20f",
    "build_date" : "2023-05-23T17:16:07.179039820Z",
    "build_snapshot" : false,
    "lucene_version" : "9.6.0",
    "minimum_wire_compatibility_version" : "7.17.0",
    "minimum_index_compatibility_version" : "7.0.0"
  },
  "tagline" : "You Know, for Search"
}
Step 3 – Install Kibana
You can run the following command to install Kibana on your server.
dnf install kibana
After the successful installation, you will need to edit the Kibana configuration file and define your server name and host. You can edit it with the following command.
nano /etc/kibana/kibana.yml
Change the following lines:
server.host: "0.0.0.0"
server.name: "kibana.example.com"

elasticsearch.hosts: ["http://localhost:9200"]
Save and close the file. Then, start the Kibana service and enable it to start at system reboot.
systemctl enable --now kibana
You can now check the Kibana status with the following command.
systemctl status kibana
Output:
● kibana.service - Kibana
     Loaded: loaded (/usr/lib/systemd/system/kibana.service; enabled; vendor preset: disabled)
     Active: active (running) since Mon 2023-06-05 12:17:15 EDT; 12s ago
       Docs: https://www.elastic.co
   Main PID: 133181 (node)
      Tasks: 11 (limit: 4666)
     Memory: 216.5M
        CPU: 13.397s
     CGroup: /system.slice/kibana.service
             └─133181 /usr/share/kibana/bin/../node/bin/node /usr/share/kibana/bin/../src/cli/dist

Jun 05 12:17:15 freepbx systemd[1]: Started Kibana.
Jun 05 12:17:21 freepbx kibana[133181]: [2023-06-05T12:17:21.001-04:00][INFO ][node] Kibana process configured with roles: [background_tasks, ui]
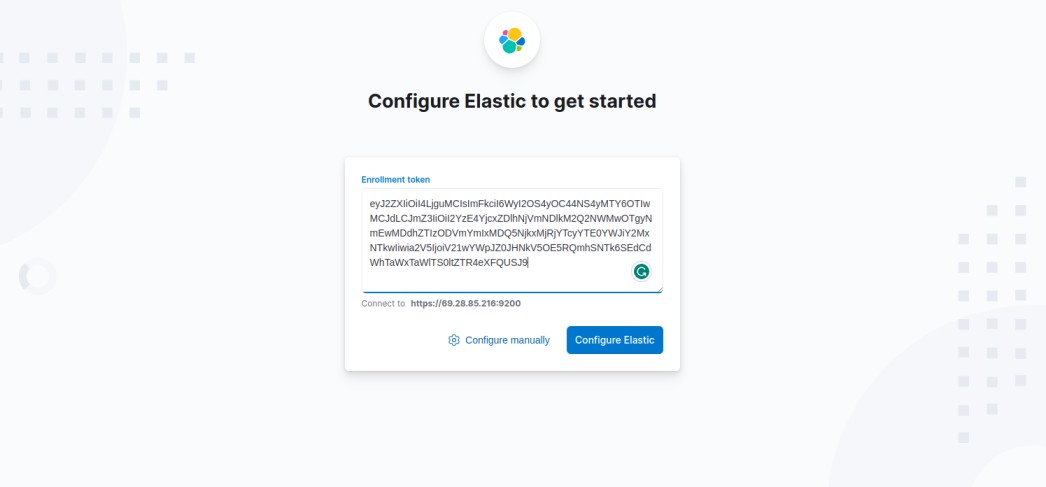
Now, open your web browser and access the Kibana dashboard using the URL http://your-server-ip:5601/. You will be asked to provide a token as shown below.
Now, run the following command to generate a token for enrollment.
/usr/share/elasticsearch/bin/elasticsearch-create-enrollment-token -s kibana
Output.
eyJ2ZXIiOiI4LjguMCIsImFkciI6WyI2OS4yOC44NS4yMTY6OTIwMCJdLCJmZ3IiOiI2YzE4YjcxZDlhNjVmNDlkM2Q2NWMwOTgyNmEwMDdhZTIzODVmYmIxMDQ5NjkxMjRjYTcyYTE0YWJiY2MxNTkwIiwia2V5IjoiV21wYWpJZ0JHNkV5OE5RQmhSNTk6SEdCdWhTaWxTaWlTS0ltZTR4eXFQUSJ9
Copy and paste the above token to the browser and click on Configure Elastic. You should see the verification screen.
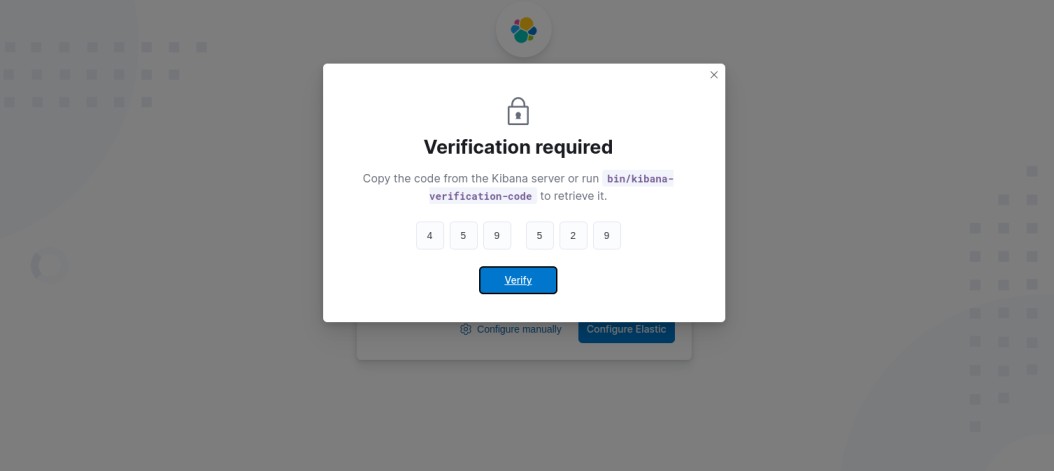
Now, get the verification code, open your terminal, and run the following command.
/usr/share/kibana/bin/kibana-verification-code
Output:
Your verification code is: 459 529
Paste the above code to the web browser and click on the verify button. After the successful verification, you should see the Elastic login page.
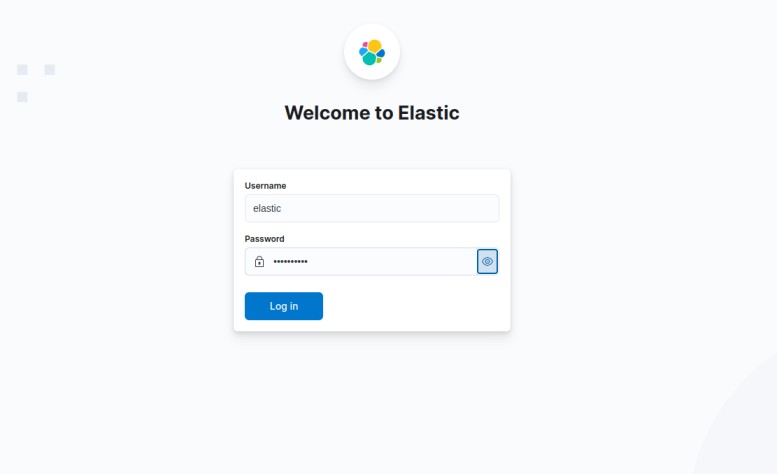
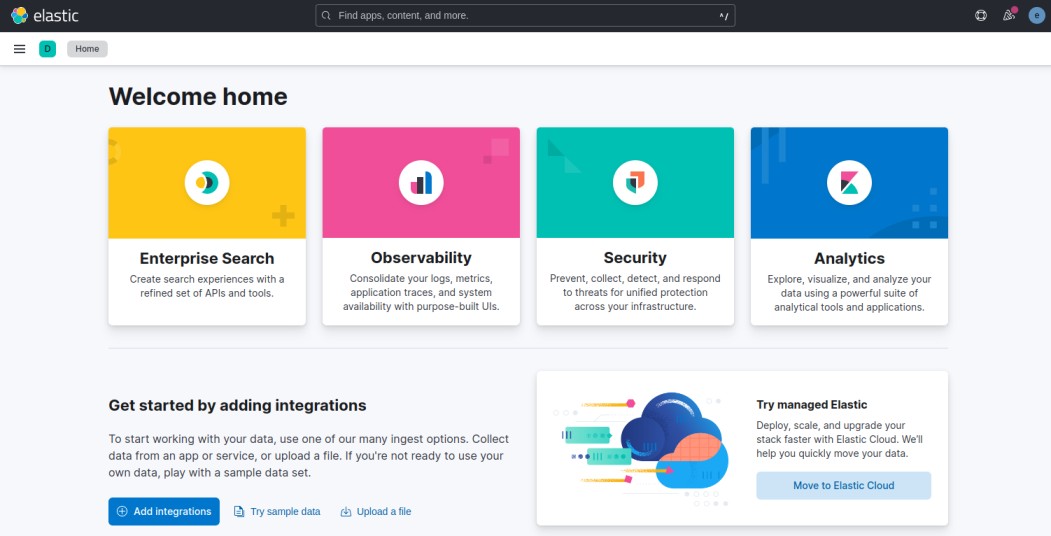
Provide your username, password and click on the Log In button. You should see the Kibana dashboard on the following screen.
Step 4 – Install Logstash
Logstash is an open-source, and server-side data processing pipeline that allows you to collect data from different sources, transform it, and send it to your desired destination. You can install it with the following command.
dnf install logstash
After the installation, start and enable the Logstash service with the following command.
systemctl start logstash
systemctl enable logstash
Conclusion
In this post, we explained how to install a complete ELK stack such as Elasticsearch, Kibana, and Logstash on Fedora. You can now implement the ELK stack in your development environment and start monitoring your application via the Kibana dashboard. Let’s try to deploy and implement an ELK stack on VPS hosting from Atlantic.Net!